Dashboard
Dashboard functions similarly to Windows Explorer. It enables you to monitor the system's resource status and observe the running status of Terminus without needing to understand the technical details. You can view Terminus status in the following dashboards:
- Overview
- Applications
- Analytics
Overview
The Overview dashboard in Dashboard provides an overview of your Terminus system. It consists of the following sub-sections:
- Physical Resources Overview
- User Resource Overview
- Application Usage Overview
- App Traffic Overview
Physical Resources Overview
The physical resource monitoring feature on the Dashboard provides an overview of your device cluster's operational status and establishes standards for regular resource consumption and cluster performance.
On the Overview page, you can see the current and historical usage of the 4 most important physical resources: CPU, memory, disk, and pod. The chart below shows the usage trend of the selected item over the last 10 minutes.
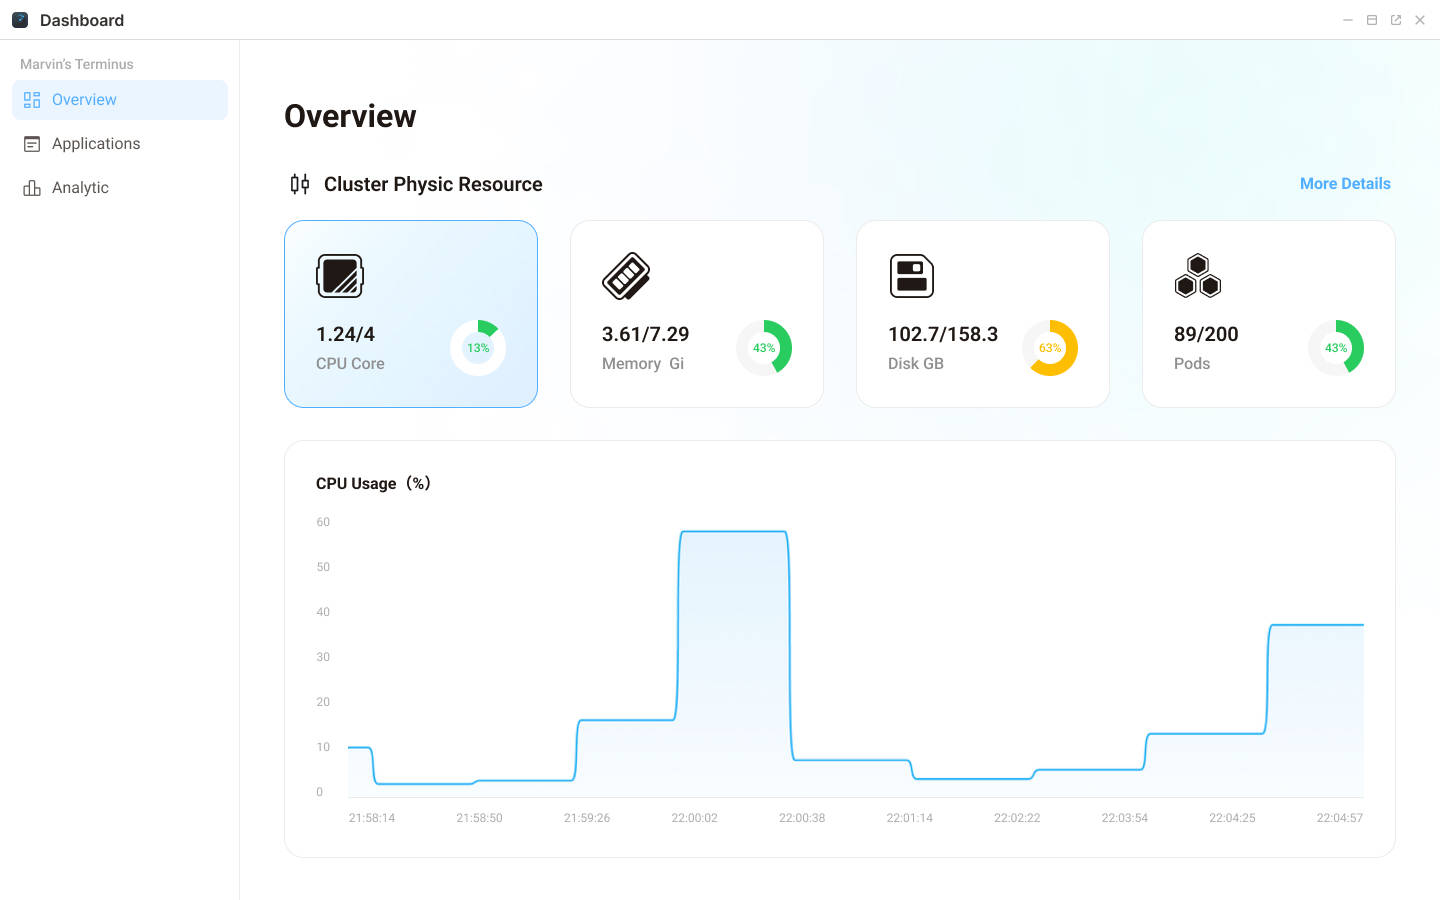
You can view the detailed physical resource usage by clicking on More Details on the right. Clicking the refresh button next to it will immediately update the monitoring data.
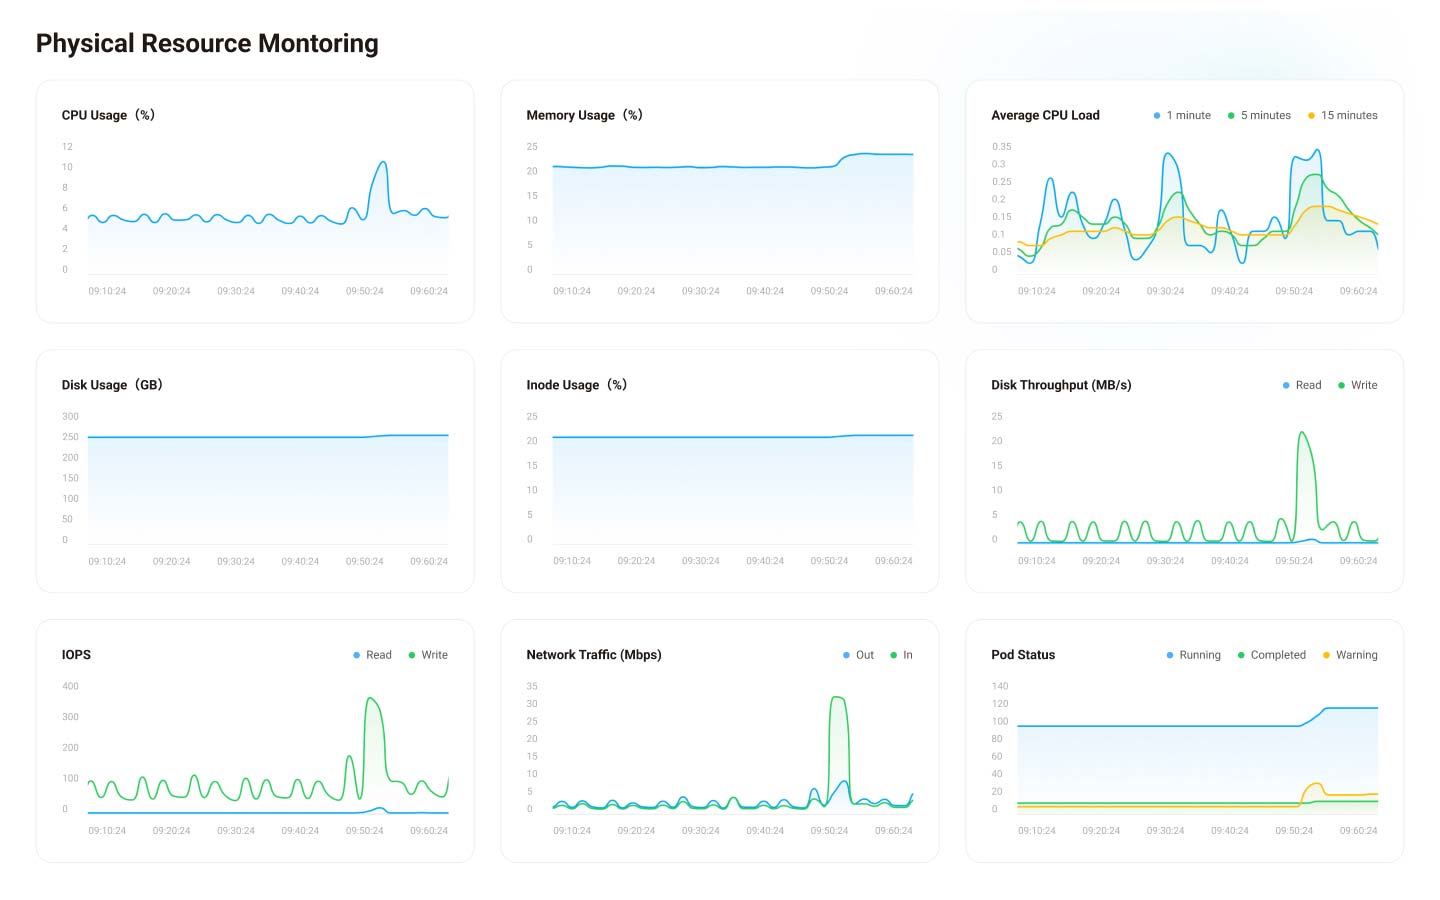
You can view the cluster monitoring data for the past 7 days, including CPU usage, memory usage, average CPU load, disk usage, inode usage, disk throughput, IOPS, network bandwidth, and pod status, as described below:
| Metric | Description | Importance |
|---|---|---|
| CPU Usage | Percentage of CPU resources used. | Prolonged spikes can slow down the cluster. |
| Memory Usage | Percentage of memory in use. | Impacts application performance and stability. |
| Average CPU Load | Average number of active processes. | High load indicates system overload. |
| Disk Usage | Percentage of disk space used. | Crucial for data reliability, prevent overuse. |
| Inode Usage | Percentage of inodes used. | Exhaustion prevents new file creation. |
| Disk Throughput | Data flow speed (MB/s) on the disk. | Important for large, non-sequential data transfers. |
| IOPS | Input/Output Operations Per Second. | Crucial for small, non-sequential data transfers. |
| Network Bandwidth | Network data transfer rate or capacity. | Reflects network speed and quality. |
| Pod Status | Number of pods in different states (running, completed, warning). | Reflects the health and status of applications. |
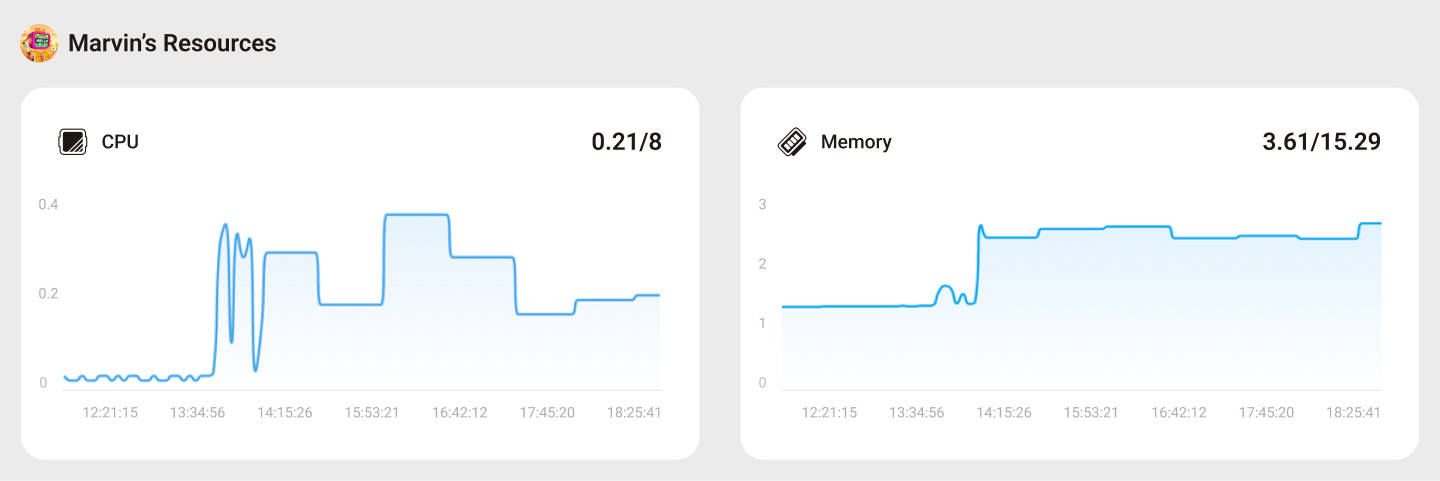
User Resource Overview
Terminus supports multiple users sharing a cluster's physical resources. The resource quota for each user is allocated by the cluster administrator.
On the Overview page, you can view the current and historical usage of resources under your account. If your user resource quota is insufficient, your Terminus may operate slowly, hinder new application installations, or even suspend some running applications with high resource overhead.
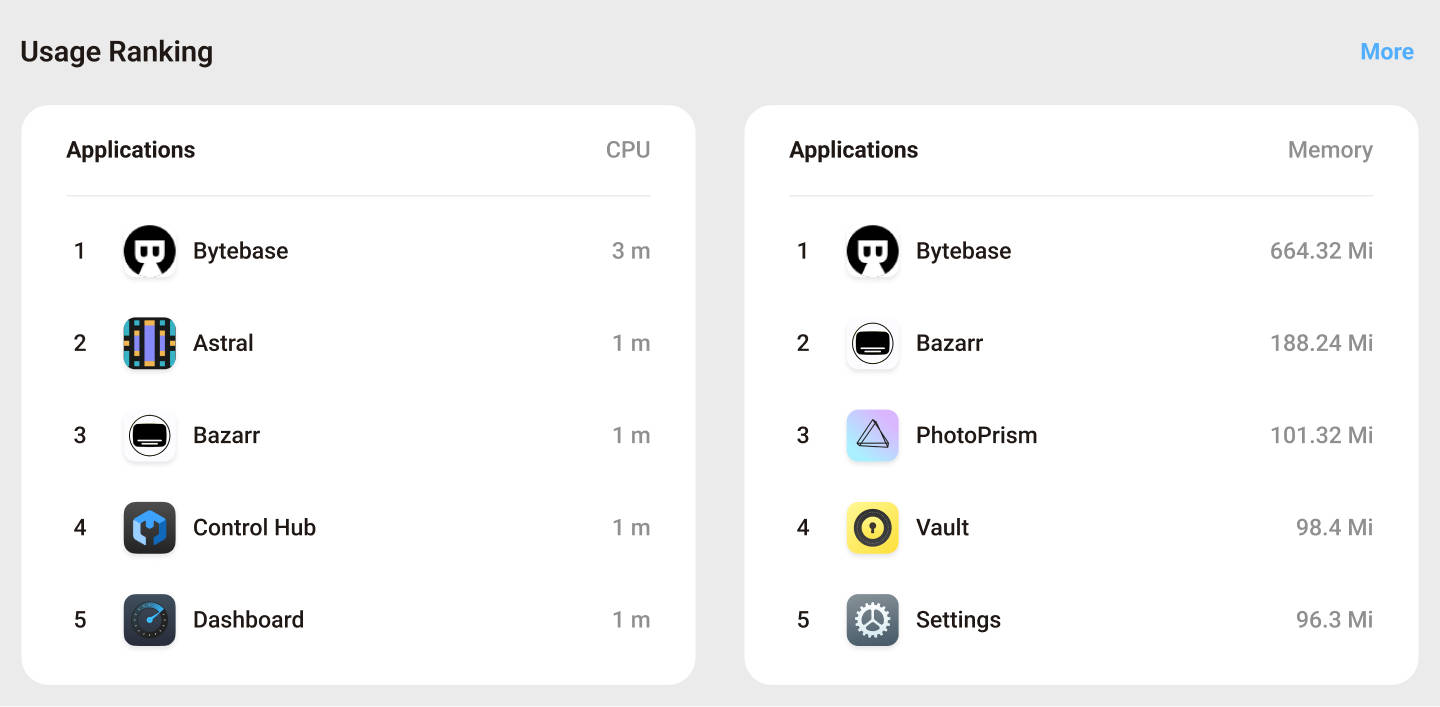
Application Usage Overview
You can quickly identify applications that are consuming significant CPU and memory resources by viewing the top 5 resource-consuming applications. Click More to view the complete list of application usage.
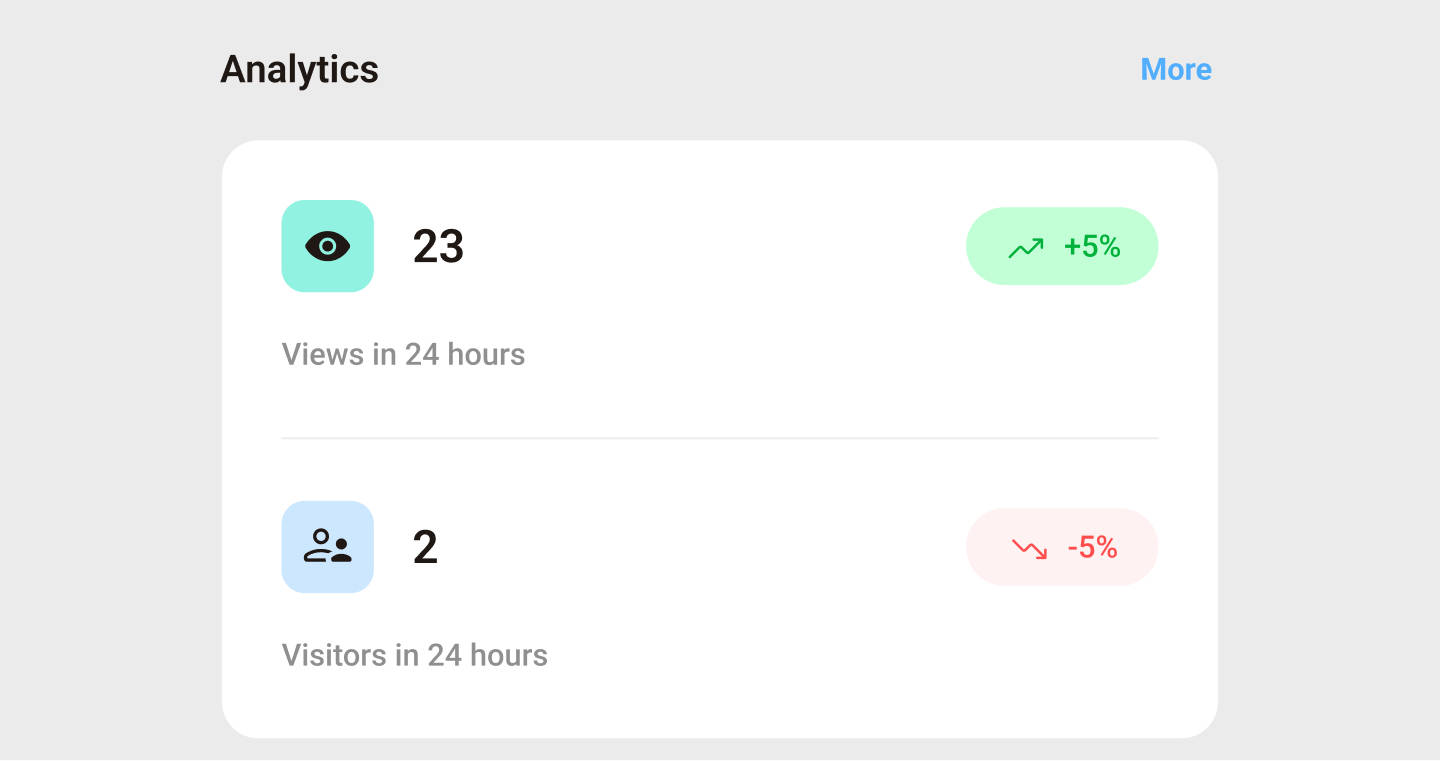
App Traffic Overview
The Analytics section on the Overview dashboard displays the view traffic for all applications within the last 24 hours. Click 'More' to access each application's detailed analytics.
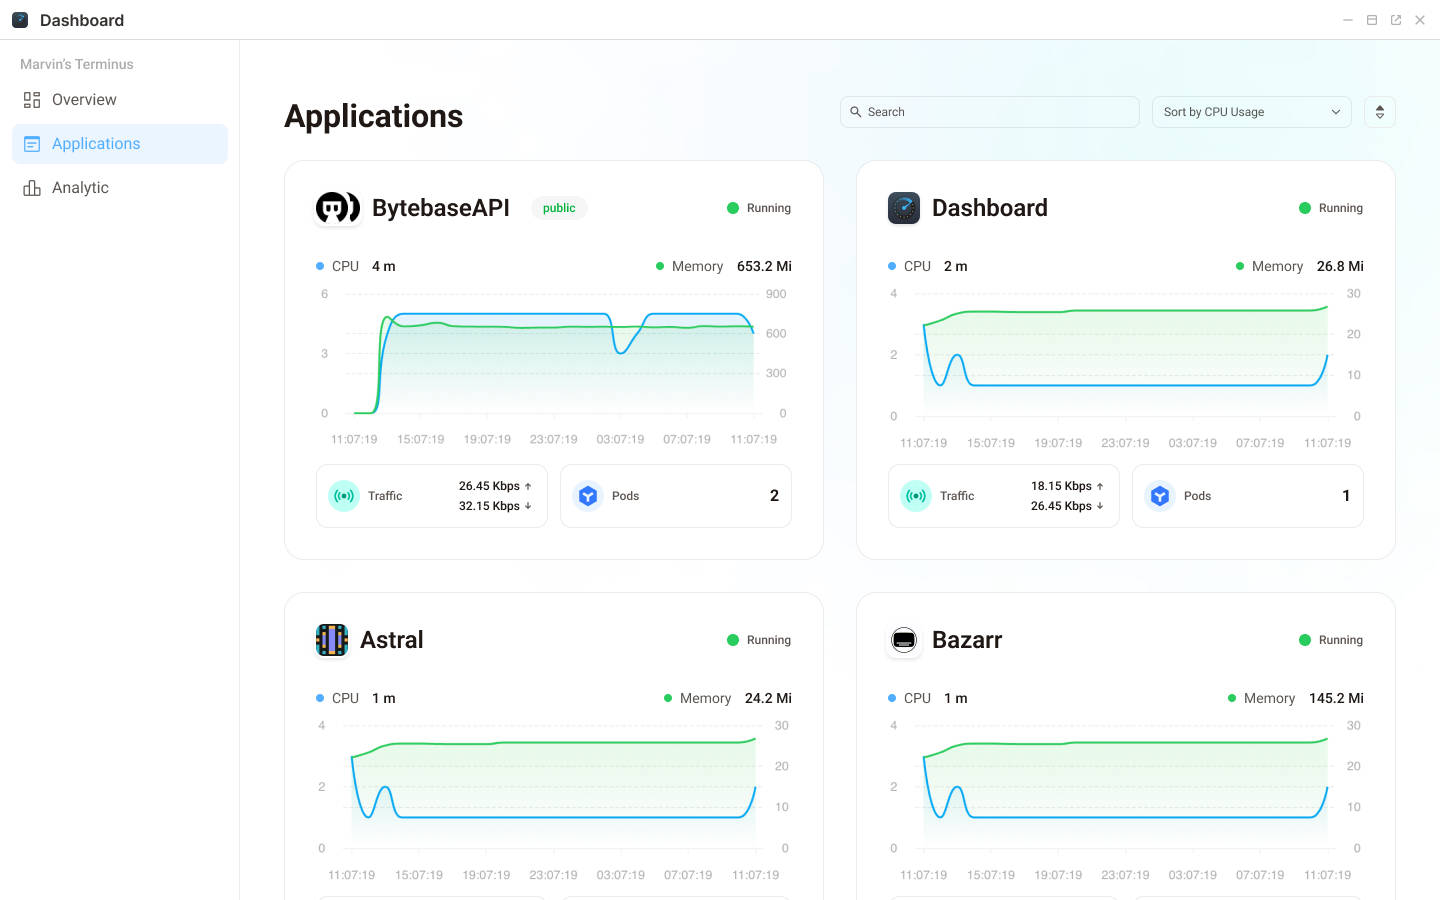
Applications
The Applications dashboard displays the operational status of all applications on Terminus. Each application is represented in a card format, providing essential metrics and statistics at a glance.
Application Entrance: Displays the entrance, title, and running status of the application. A public entrance will be indicated with a public tag. If an application has multiple entrances, you can click the icon to switch.
Resource Usage: The chart on the card provides the physical resource usage of this application, including CPU usage, memory usage, network usage, and number of pods. You can see the specific CPU and memory usage at any given moment by hovering over the chart.
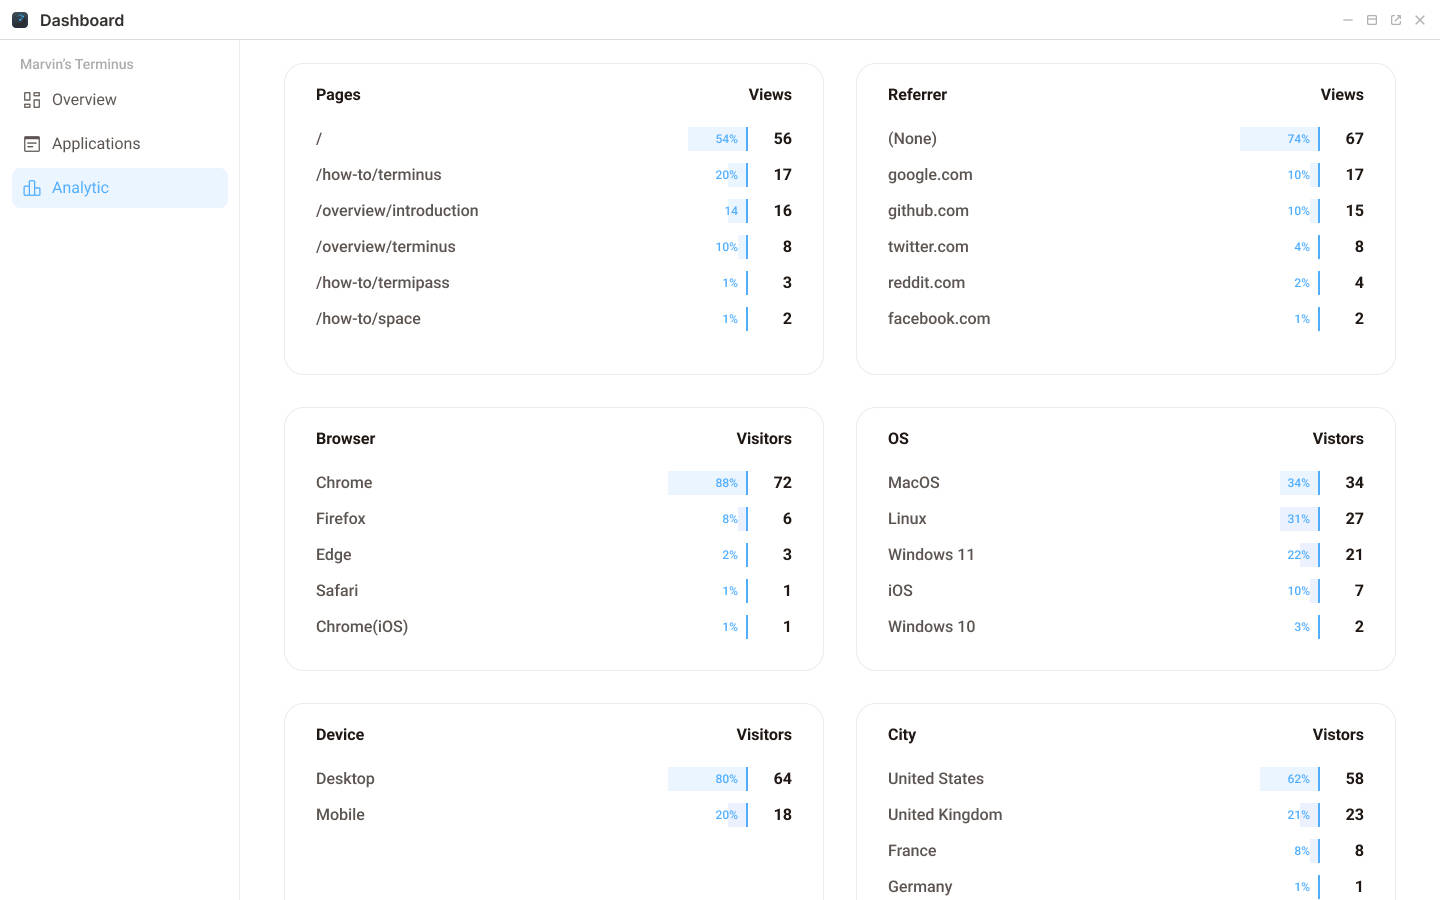
Analytics
TIP
Prerequisites
Only applications that have declared the analytics function in the TerminusManifest.yaml can see analytic data in Dashboard.
Terminus OS offers built-in website analysis functionality, powered by umami. The Analytics page displays Page View, Unique Visitors, and Average Visit Time statistics for each application over the past 24 hours. For more detailed analysis, please click on the application card.
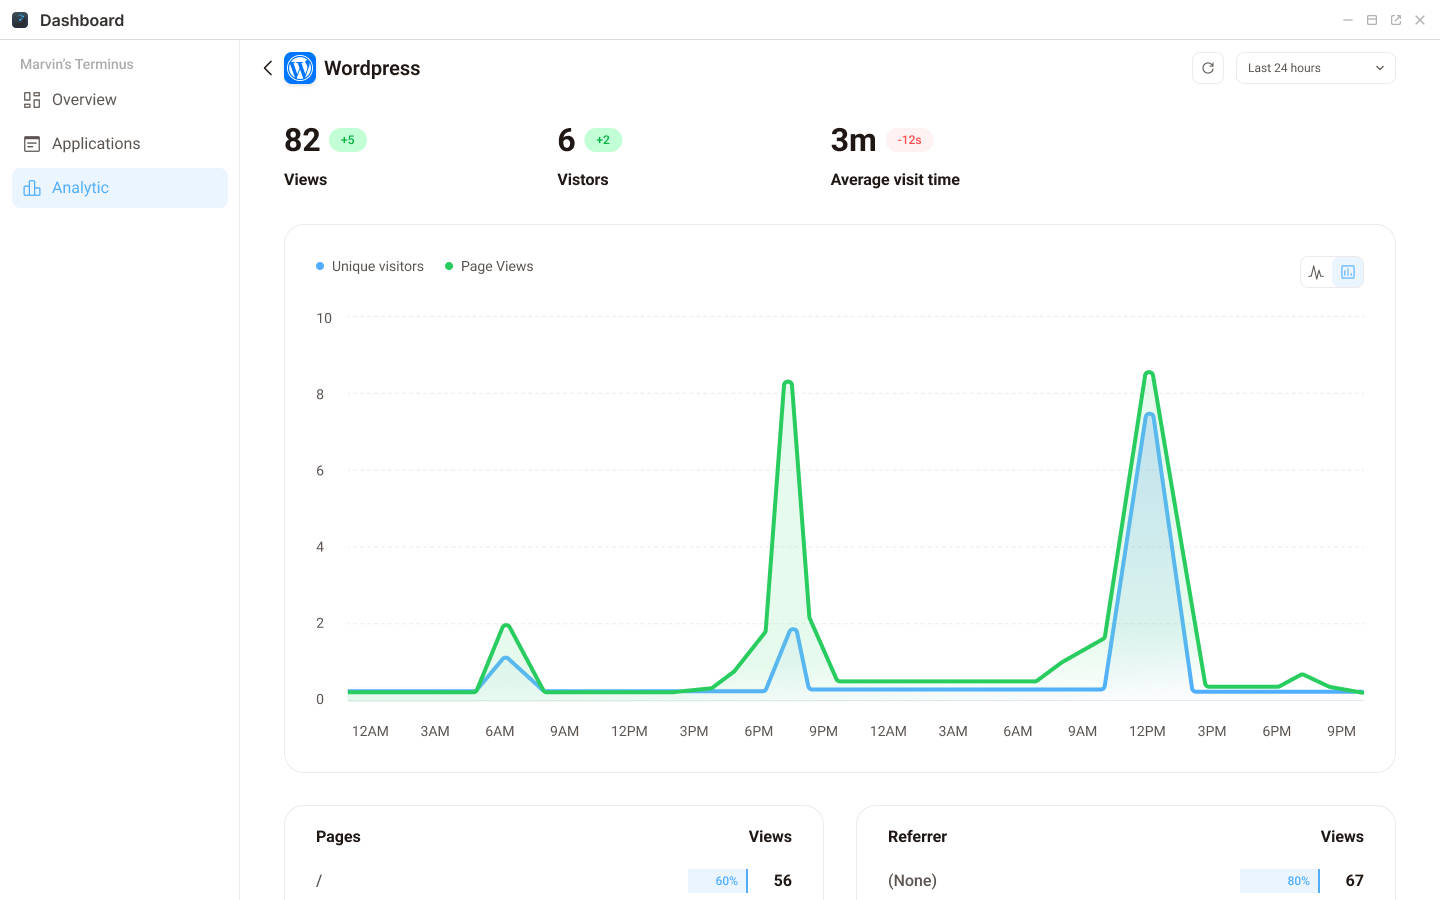
You can find the analytic data within one year on the details page. To analyze data from different periods, click the dropdown list in the upper right corner. To update the data immediately, click the refresh button.
Here's a brief introduction to the analytical metrics on the detail page:
| Metric | Description | Use |
|---|---|---|
| Views | The number of times a webpage is accessed by users. Each access is counted separately, even for the same user. | Analyzing webpage traffic and improving content. |
| Visitor | Unique individuals who have accessed the website at least once. Multiple visits by the same user within a specific timeframe count as one visitor. | Analyzing website traffic, gauging the effectiveness of website promotion, and understanding the size of the user group. |
| Average visit time | The average time users spend on the website during a session. | Measuring user engagement. |
| Referrer | The webpage a user was on right before landing on your page. | Understanding the source of website traffic. |
| Visitor info | Basic demographic details about visitors, including device, browser, operating system, and location. | Building user personas for the website. |